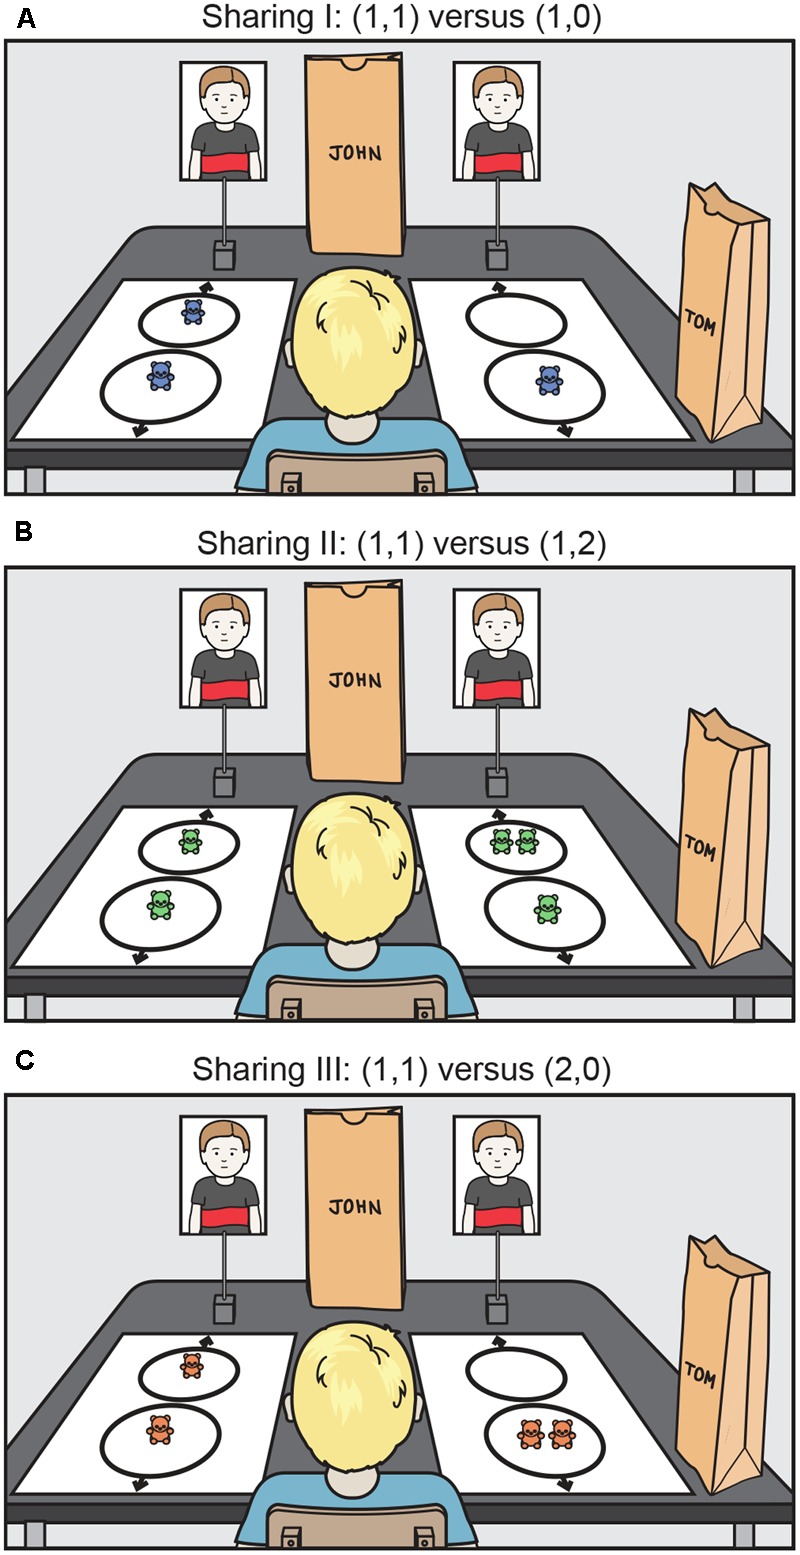
FIGURE 2.

The test used to measure child sharing. The participant is in the foreground, and two photographs of the peer are at the far end. In this example, the participant is Tom, and the peer is John. The participant’s task was to choose one of the distributions (shown in the white rectangles; left/right positioning counterbalanced). The near circle contained the bears for the self; the far circle contained the bears for the peer. Thus, in (A) (left rectangle) there was one bear for the self and one for the other, as represented by (1,1). The choices were as follows: (A) Sharing I: (1,1) versus (1,0), (B) Sharing II: (1,1) versus (1,2), and (C) Sharing III: (1,1) versus (2,0). After the participant made a choice, the appropriate number of bears were deposited in the bags (and the bears for the unselected choice were removed from the table). The other two Sharing tasks were administered in the same manner. These tasks were adapted from Fehr et al. (2008).
