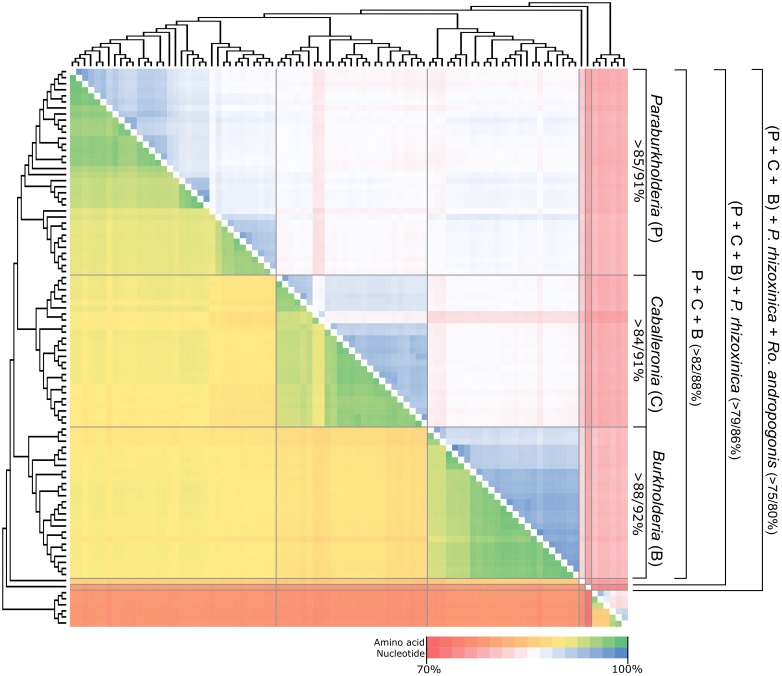
FIGURE 1.
A heat map depicting the sequence similarity of the concatenated sequence of the conserved 106 genes used for phylogenetic analysis. The cladogram indicating the various intra- and intergeneric relationships were inferred from the amino acid based ML topology. Nucleotide similarity values are indicated in the upper triangle of the map, with amino acid similarity values indicated in the lower triangle of the map. A summary of the similarity values for the 5 lineages of interest are indicated for each group (nucleotide/amino acid %), in the panel on the right. For specific values, refer to Supplementary File S1.

