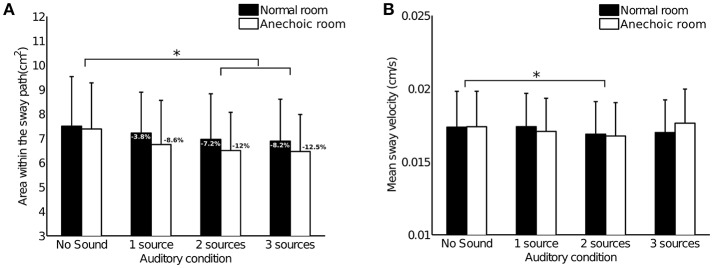
Figure 2.
Results of Experiment 1. Bars represent the 95% confidence interval. Stars stand for a significant difference between the auditory conditions (p < 0.05). Analyses did not highlight significant differences between the two rooms nor significant interactions between the rooms and the auditory conditions. (A) Mean area within the sway path across subjects (n = 35). Percentages indicate decrease in sway comparing each condition with the “No Sound” reference condition. (B) Mean sway velocity across subjects (n = 35).

