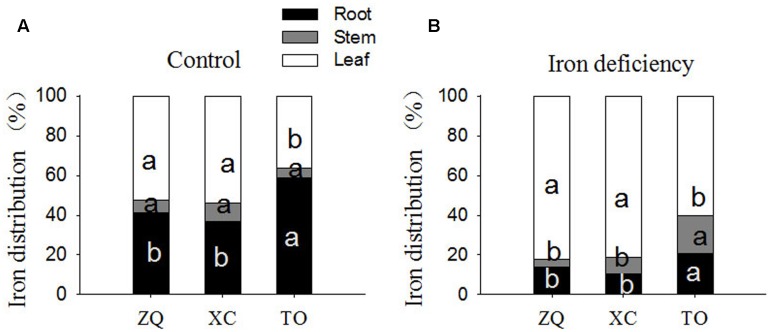
FIGURE 5.
Fe distribution in roots, stems and leaves of ZQ, XC, and TO grown in control and iron deficiency nutrient solution for 100 days. (A) Fe distribution in roots, stems, and leaves of ZQ, XC, and TO under control. (B) Fe distribution in roots, stems and leaves of ZQ, XC, and TO under iron deficiency. Letters (a, b, and c) indicate significant differences within samples via Duncan’s multiple range test P < 0.05 (Means ± SEM, n = 3).

