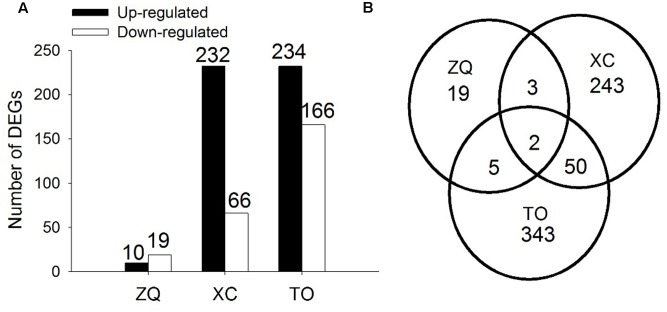
FIGURE 6.
Differentially Expressed Genes in roots of citrus rootstocks in 24 h of control and iron deficiency conditions. (A) Numbers of differentially expressed genes. (B) Venn diagram showing the number of genes that are differentially expressed in ZQ, XC, and TO, including shared and independent genes.

