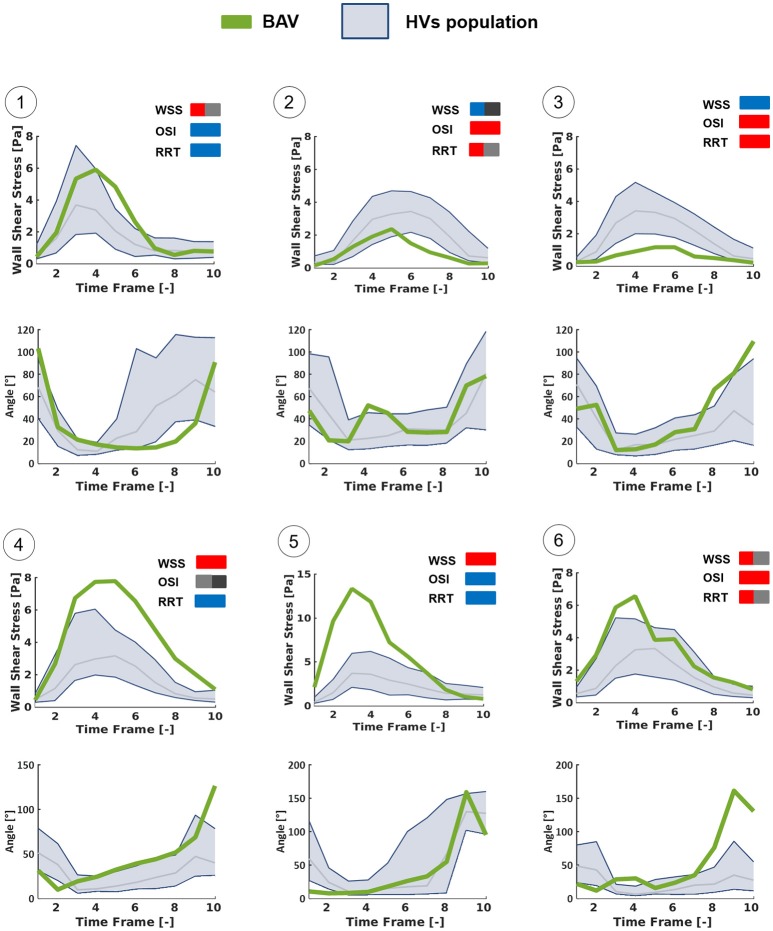
Figure 10.
Time-dependent WSS waveforms computed at the selected hot-spots detailed in Figure 9 using the LP method, throughout the systolic phase. Each BAV patient-specific case (green line) was compared with HVs population (blue zone: from 10th to 90th percentiles) in terms of the magnitude of WSS vector and of the angle between it and the axial direction of the vessel.

