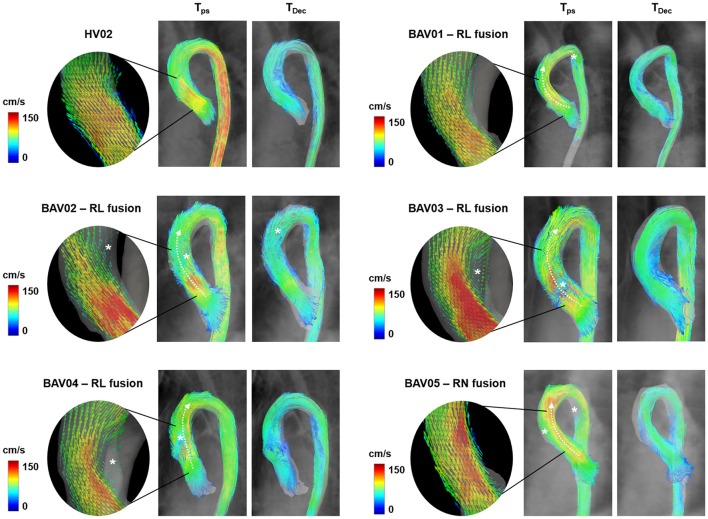
Figure 4.
Visualization of 3D blood flow streamlines within the aortic lumen at the time-frames corresponding to peak-systole (Tps) and to mid-deceleration phase (TDec). In rounded panels, the features of blood flow jet across the aortic valve during systolic ejection are highlighted through vectors projected on a long-axis view of the left ventricle outflow tract. White asterisks are reported in presence of macroscopic altered secondary flows.

