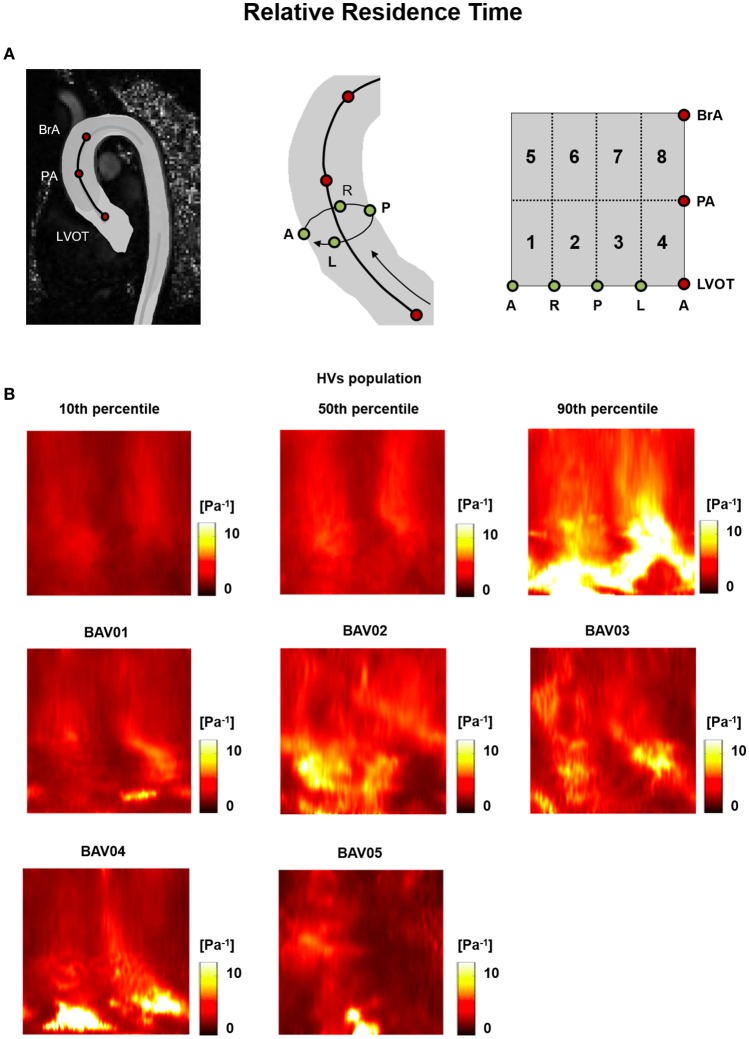
Figure 7.
(A) The 2D template detailed in Figure 3 is reported for the sake of clarity. (B) Relative Residence Time (RRT) heat maps for HVs (represented as 10th, 50th, and 90th percentiles) and for each BAV patient obtained through time-averaging over the systolic phase.

