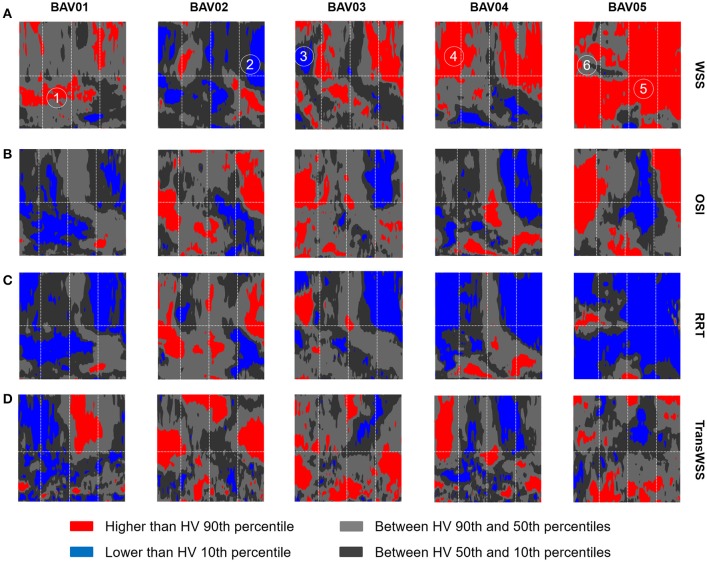
Figure 9.
Representation on the 2D template detailed in Figure 3 of the HV-relative heat maps of WSS (A), OSI (B), RRT (C), and TransWSS (D) computed for each BAV patient. The HV-relative heat maps are obtained from point-wise comparison of each BAV patient against HVs population and color-coded accordingly: higher than 90th percentile (red), lower than 10th percentile (blue), between 90th and 10th percentiles (light gray, dark gray). On the HV-relative heat maps, six hot-spots were labeled and identified.

