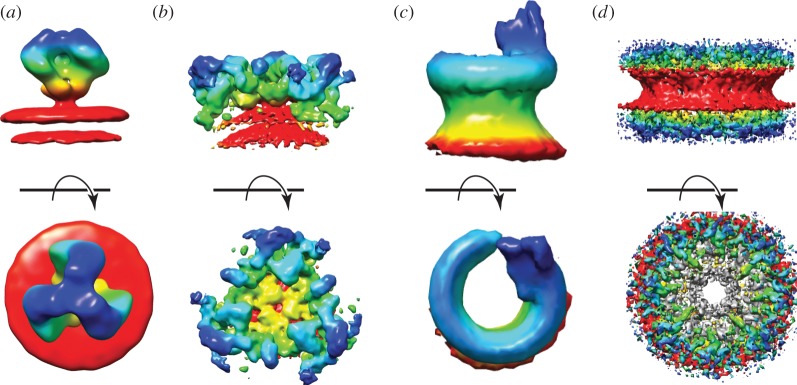
Figure 2.
Gallery of membrane-associated proteins, structures determined through the application of tomography and sub-tomogram averaging. Surfaces are coloured based on distance from the membrane with which the complex is associated. The red surface represents the membrane or the area where the membrane is associated, and the blue represents the component of the complex furthest away from the membrane. (a) The structure of the HIV-1 glycoprotein GP120 resolved on the virus. (b) The structure of the COPI coat resolved on the surface of in vitro assembled vesicles. In panel (c), we show the MAC, and in (d), there is a cumulative view of the NPC resolved on purified nuclear membranes. All panels have been generated from the density maps deposited on the EMDataBank (EMD: 5272, 2985, 3289, 3006–3009).

