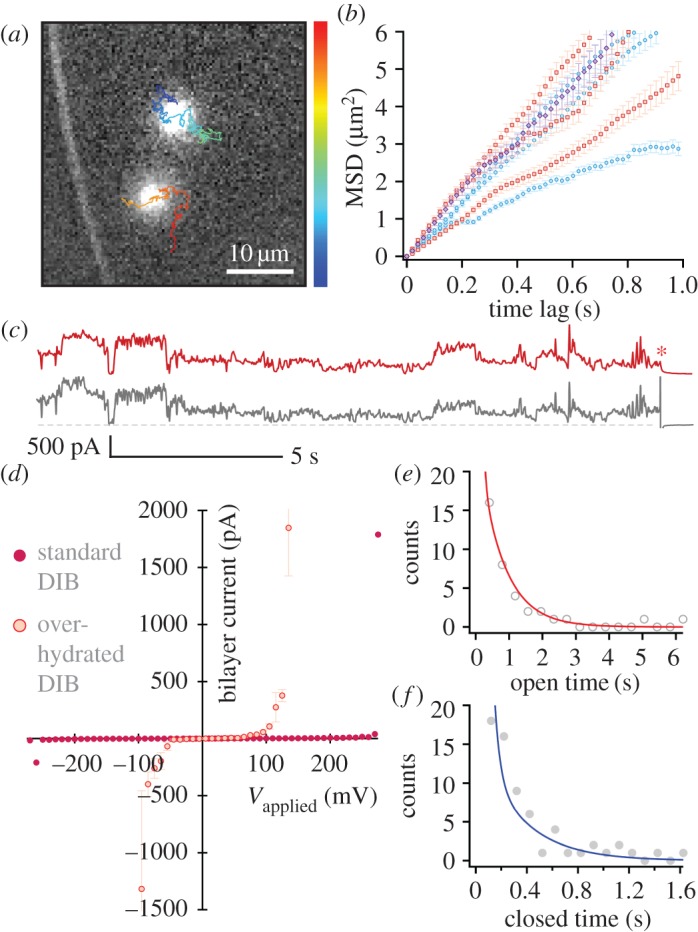
Figure 2.

Electropores on an aqueous cushion. Cushion height varied from 25 to 90 μm. (a) Pores observed at 330 mV. The overlaid tracks show the trajectories of the pores, running from the start (blue) to the end (red) of the recording. Image is a single 20 ms exposure. (b) MSD versus t plots for pores at 250 mV (red), 330 mV (blue) and 415 mV (purple). The mean lateral diffusion coefficient was  μm2 s−1 (n = 8). Error bars are the standard error for each MSD value. (c) oSCR trace (red) and corresponding electrical recording (black) for a single electropore at 210 mV. The red asterisk indicates the point at which the voltage was switched off. The grey dashed line represents 0 pA. (d) Typical I–V curve for an over-hydrated (red) and standard DIB (purple). Over-hydrated bilayers were found to rupture at lower potentials compared with standard bilayers exposed to the same protocol. Data points are the mean bilayer current at each applied potential; error bars are one standard deviation. (e) Pore open and (f) pore closed lifetime histograms fitted with double exponentials; n = 12. The lifetimes derived from these fits (τ1,o = 61.2 ± 0.5, τ1,c = 42.9 ± 1.7, τ2,o = 748.5 ± 11.1, τ2,c = 328.1 ± 22.6 ms) are essentially unchanged from those found in standard DIBs.
