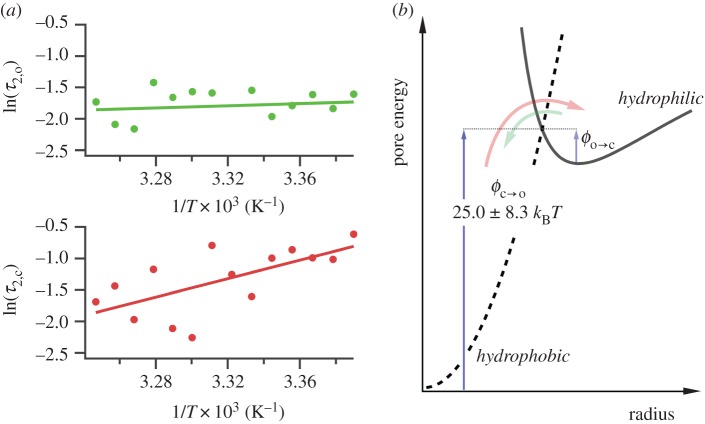
Figure 3.
Temperature dependence of electroporation. (a) Arrhenius-type plots for electropore open (upper) and closed (lower) lifetimes. The data shown here are for the τ2 lifetimes. τ1,o and τ1,c showed the same trend as their longer counterparts (electronic supplementary material, figure S2b). Each data point is derived from at least five pores (maximum 337, mean 54). Error bars, derived from the standard deviation of the fits that revealed the lifetimes, are obscured by the data points. (b) Detail of the hydrophobic–hydrophilic energy curves. The colours of the arrows correspond to the data in (a): τ2,c is the period a pore spends attempting to overcome  (red); τ2,o is the average time a pore resides in the hydrophilic regime before returning to a closed state via
  (green).

