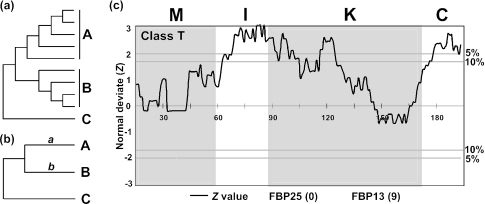
Figure 1.
(a) Gu (6) and Knudsen and Miyamoto's tests (7). Groups A and B include many sequences to be compared, and C is the outgroup. (b) A and B represent two sequences to be compared, and C is the outgroup. (c) Comparison of the protein sequences of 2 class T MADS-box genes from petunia. For the outgroup two rice sequences were used. If FBP25 (the former) evolved faster than FBP13 (the latter) in a window, the Z-value is positive, and if the former evolved slower than the latter, the Z-value becomes negative. The number in a parenthesis for each gene is the number of interacting protein partners given by Immink et al. (29). Horizontal lines with ‘5%’ or ‘10%’ correspond to the cutoff Z-value of 1.96 or 1.65, respectively. The amino acid positions are given on the Z = 0 line. M, I, K and C represent the M, I, K and C domains. Window size (w) and skipping size (s) are 30 amino acids and one amino acid, respectively.

