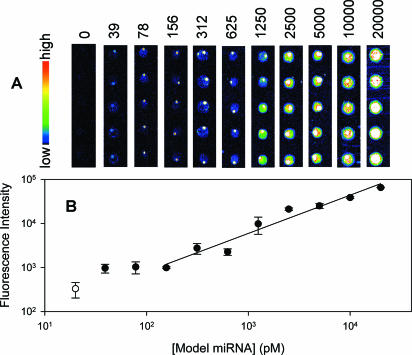
Figure 2.
Detection limit and dynamic range of the model miRNA detection microarray. (A) Image sets of microarrays hybridize with various concentrations of miRNAs from 20 nM to 39 pM and the backgound. The 50 μM concentration of oligonucleotide probes printed on slides pentaplicately. The volume of model miRNA needed to hybridize with microarray was 10 μl. (B) Correlation between fluorescence intensity of spots and concentrations of model miRNA. The values were calculated from image in (A). Open circle represents the background.

