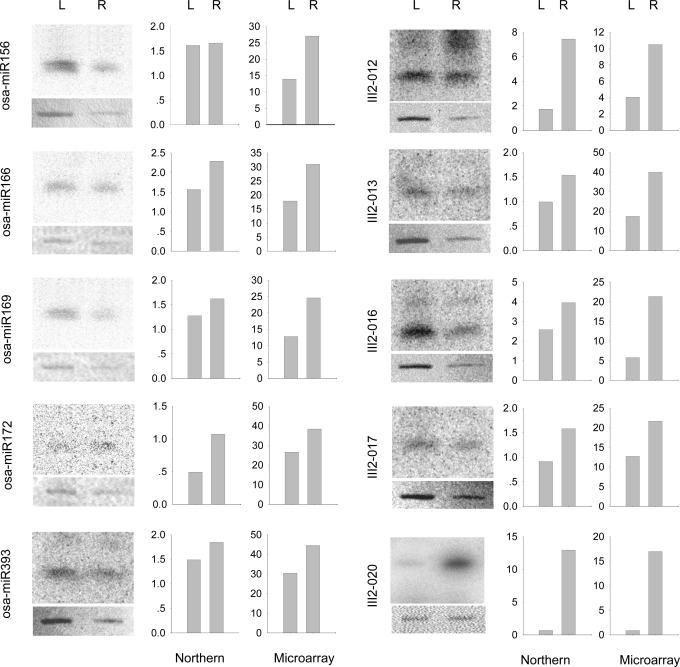
Figure 6.
Comparison of microarray data with northern blots of miRNAs from leaves and roots of rice seedlings. Left panel for the five miRNAs selected from miRNA Registry and right panel for the five miRNAs cloned in our laboratory. The y-axis for the microarray data refers to the averaged mean fluorescence intensities, and y-axis for northern blots data to radioactivity. 5S rRNA immobilized on membrane was stained as control for comparison.

