
Fig. 1.
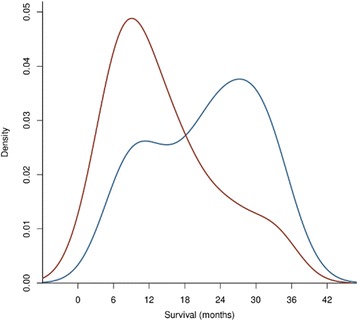
Overall survival distributions for the development (SuMR) and validation (SCOTRRCC) cohorts. Kernel density plots are shown for all survival data, including censored data. The above distributions indicate bimodality for both cohorts studied, with similar mode positions around 11 and 27 months. These survival modes align with survival subgroups reported in pivotal studies [3, 4, 30]. The development cohort (blue) had the greatest proportion of patients in the mode centred around 27 months, reaching a density value of 0.037. The majority of patients in the validation cohort (red) are in the survival mode around 11 months (reaching a density value of 0.049), partly due to greater censoring in this cohort