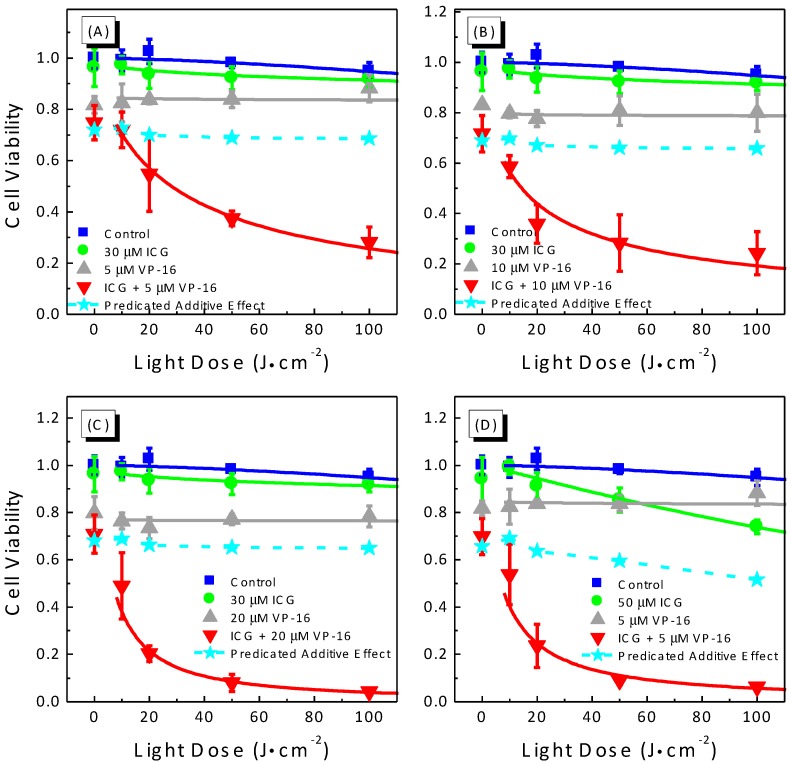
Figure 3.
Light-dose response curves (A–D) for cell viability of A549 cells treated with the combination of ICG-PDT and VP-16. Cells were treated with ICG and VP-16 for 4 h after overnight incubation and then irradiated with an 800 nm laser at a light dose of 100 J/cm2. Cell viability was measured by the standard MTT assay. The solid lines are best fits to the experimental data using a logistic function in Origin software. The dashed lines and filled stars represent the calculated additive effect.

