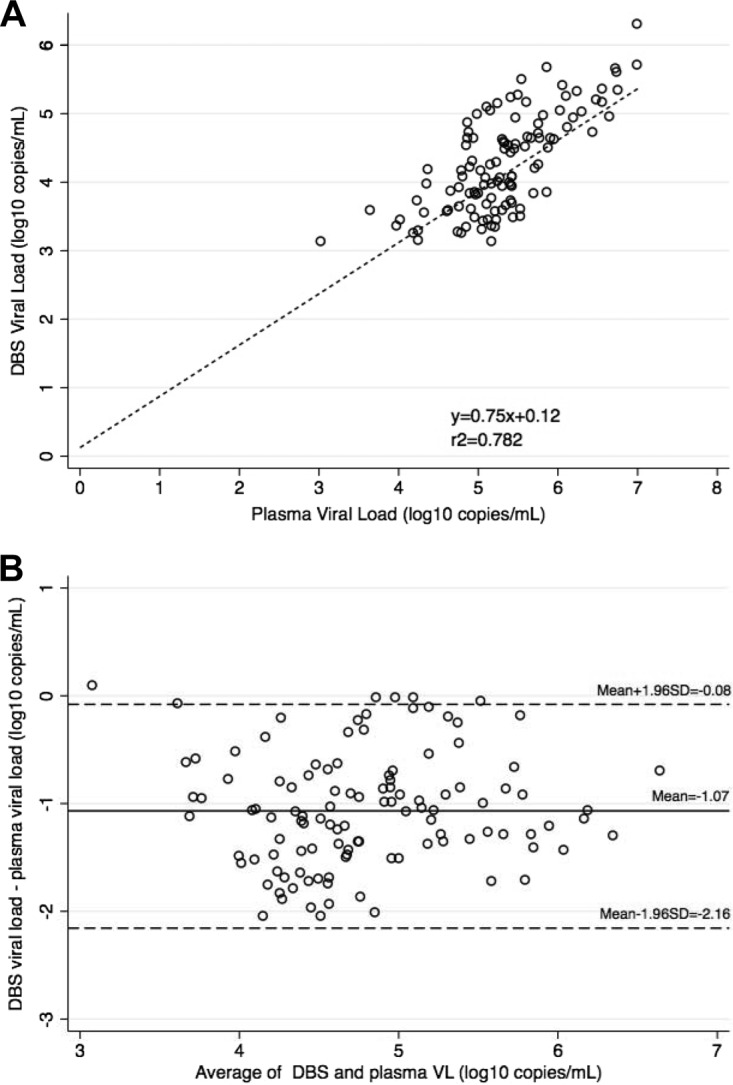
FIG 1.

HIV viral load in DBS and plasma samples. (A) Correlation between paired VL measurements obtained from plasma and DBS samples with VL >1000 copies/ml (n = 114). Pearson coefficient of determination: r2 = 0.782, P < 0.0001. (B) Bland-Altman plot showing measurement agreement between DBS and plasma. The mean difference was −1.06 (95% CI, −1.17 to −0.97) log10 copies/ml. The limits of agreement (dotted lines) were −2.16 (95% CI, −2.32 to −1.99) and −0.08 (95% CI, −0.25 to 0.09) log10 copies/ml.
