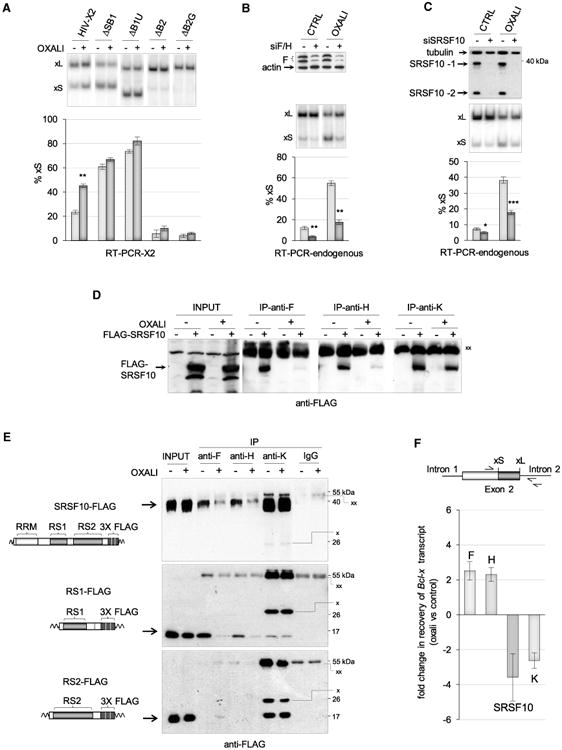
Figure 3. The Bcl-x Splicing Shift Induced by Oxaliplatin Requires SRSF10 and hnRNP F/H, and Is Associated with the Loss of Interaction between SRSF10 and hnRNP F/H.

(A) The X2 minigene and derivatives lacking different elements were transfected into 293 cells. Four hours later, cells were treated with oxaliplatin for 24 hr. The impact of oxaliplatin on Bcl-x splicing was determined by RT-PCR. (B) The role of hnRNP F/H was tested by depleting hnRNP F/H by RNAi. The top panel shows an immunoblot for hnRNP F. The middle and bottom panels show the results of the RT-PCR assays to detect endogenous Bcl-x transcripts. (C) The role of SRSF10 on the oxaliplatin-induced Bcl-x splicing shift was tested by depleting siSRSF10. The top panel confirms the depletion of SRSF10. The middle and bottom panels show the results of the RT-PCR assays on endogenous Bcl-x transcripts. (D) Immunoprecipitation of FLAG-SRSF10 was performed with anti-hnRNP F, H, and K antibodies using extracts prepared from cells treated or not with oxaliplatin, and expressing or not FLAG-SRSF10. The input content of FLAG-SRSF10 is shown and represents 1/50th of the samples used for immunoprecipitation. Immunoprecipitates were fractionated on gel and proteins were transferred to nitrocellulose decorated with anti-FLAG antibodies. “xx” indicates the large immunoglobulin subunit used for the immunoprecipitation that reacts with the secondary antibody. (E) The immunoprecipitation assays used cells expressing SRSF10-FLAG, RS1-FLAG, or the RS2-FLAG treated or not with oxaliplatin. The procedure is as described in (D). Anti-K antibodies are from mouse, whereas anti-F and anti-H antibodies are from rabbit. A rabbit IgG was used for the control immunoprecipitation. “xx” and “x” indicate the large and small immunoglobulin subunits that react with the secondary anti-mouse antibody, respectively. (F) Immunoprecipitation was carried out on cells treated or not with oxaliplatin. The recovered RNA was quantitated for Bcl-x pre-mRNA using primers shown on the top. Raw data are provided in Table S1. The differential between values obtained for each antibody comparing the impact of oxaliplatin is plotted in histograms. The result obtained with IgG control immunoprecipitations is provided in Table S1. Also shown in Table S1 are the results obtained from two experiments comparing immunoprecipitations performed with cells treated with formaldehyde and untreated cells.
