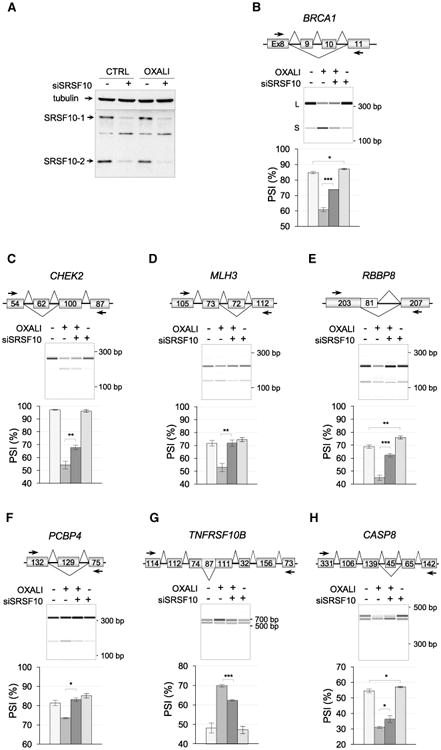
Figure 6. Impact of the Depletion of SRSF10 on the Oxaliplatin-Induced Splicing Shifts.

(A) Immunoblot showing the siRNA-mediated depletion of SRSF10 in cells treated or not with oxaliplatin. (B–H) For each subsequent panel, the name of the gene and the structure of its relevant portion are shown. (B) BRCA1. Exon numbers are shown. (C) CHEK2. Size of exons in nucleotides. (D) MLH3. Size of exons in nucleotides. (E) RBBP8. Size of exons in nucleotides. (F) PCBP4. Size of exons in nucleotides. (G) TNFRSF10B. Size of exons in nucleotides. (H) CASP8. Size of exons in nucleotides. In each panel, the RT-PCR analysis presents electrophero-grams with molecular weight markers. Triplicate experiments are shown as histograms with percent splicing index (PSI). Error bars indicate SD. Asterisks indicate significant P values obtained when comparing control with siSRSF10 or samples treated with oxaliplatin with samples treated with both siSRSF10 and oxaliplatin; *p < 0.05, **p < 0.01, and ***p < 0.001.
