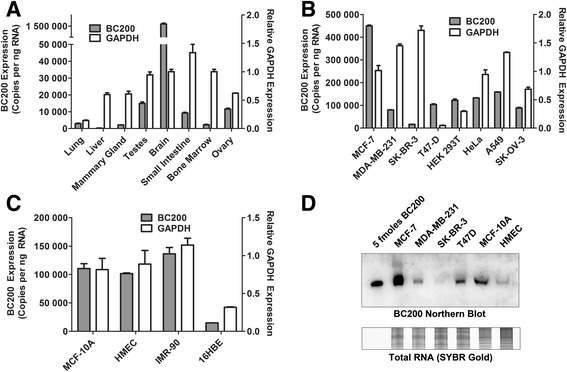
Fig. 1.

Analysis of BC200 expression in normal human tissue, cancer cell lines and primary cells. (a) BC200 expression was assessed by RT-qPCR in a panel of eight human tissues. Absolute BC200 quantification data is plotted on the left y-axis whereas relative GAPDH expression is plotted on the right y-axis. Data represents the mean of three replicate measurements +/− standard deviation. (b) As in (a), BC200 and GAPDH expression were assessed in a panel of eight immortalized cell lines. (c) As in (a), BC200 and GAPDH expression were assessed in a panel of four primary and non-tumorigenic cell lines. (d) BC200 expression was assessed by northern blot in a panel of six cell lines relative to 5 fmoles of in-vitro transcribed BC200 (upper panel). Total RNA was visualized on a duplicate gel by staining with SYBR Gold (lower panel)
