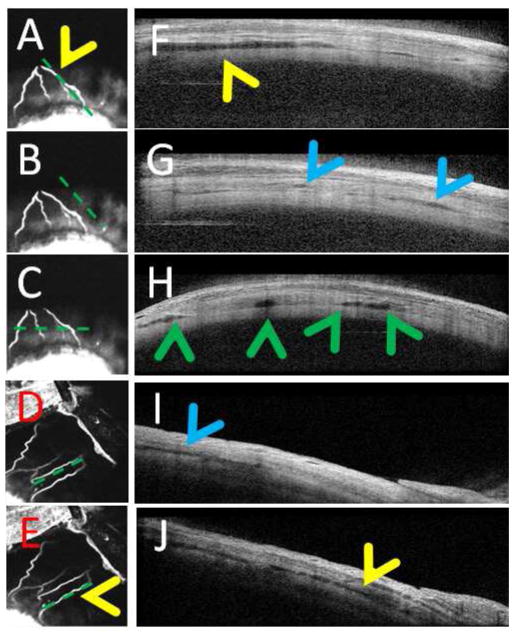
Figure 3. Aqueous Angiography and Anterior Segment Optical Coherence Tomography.
(A–C) Aqueous angiography (ICG) of the superior portion of the NHP-B eye showed an inferior pointing fork-like arrangement with 4 arms. (D/E) Aqueous angiography (ICG) of the superior-nasal portion of NHP-C eye showed a more linear arrangement. (F/H/J) Anterior segment OCT in angiographically positive areas (A/C/E) showed more intrascleral lumens (yellow and green arrowheads). (B/D) Angiographically negative regions showed (G/I; blue arrowheads) much less but still present lumens that many have corresponded to other intrascleral luminal structures such as arteries. Note that the horizontal anterior OCT scan pattern (C) cut across two angiographic arms on the left and near the root of another angiographic branch on the right corresponding to (H) four lumens on OCT (green arrowheads).

