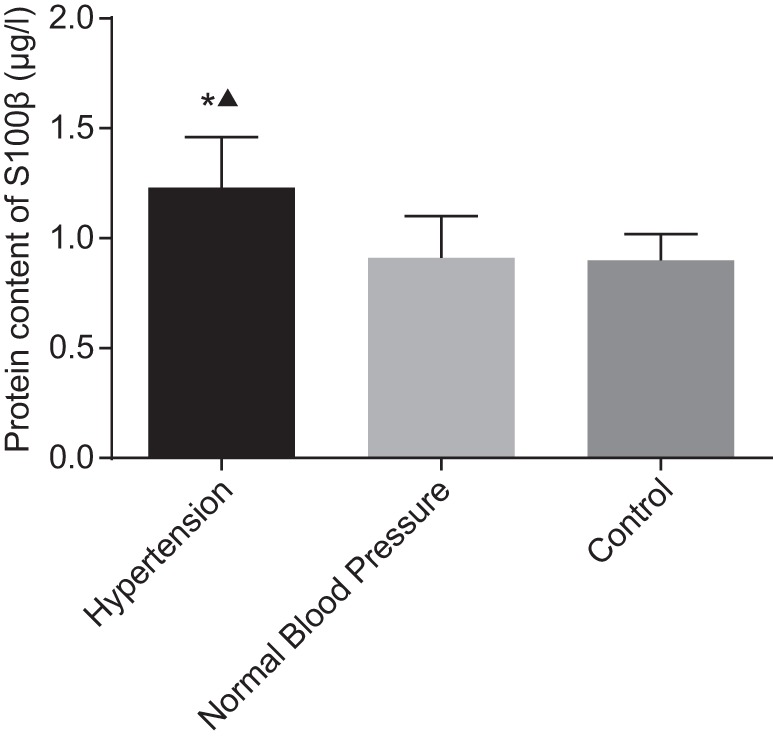
Figure 3. Comparison of serum S100β level among the hypertension group, the normal blood pressure group, and the control group.

*, compared with the normal blood pressure group, P<0.05; ▲ compared with the control group, P<0.05.

*, compared with the normal blood pressure group, P<0.05; ▲ compared with the control group, P<0.05.