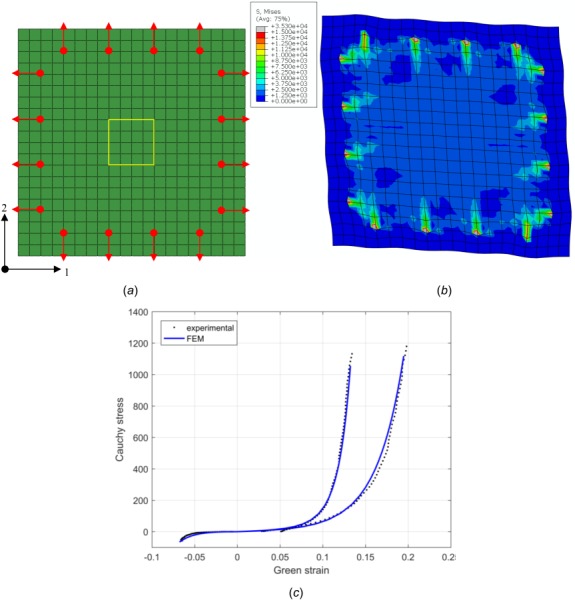
Fig. 1.

FE meshes used in the biaxial test simulation: the arrows denote the loading directions with their round roots showing the sites of loading, the box enclosed region in the center represents the area delineated by the four markers in the biaxial test (a), Von Mises stress contour in the deformed configuration (b), and curves of Cauchy stress versus Green strain resulted from experiment (dashed line) and numerical simulation (solid line) (c)
