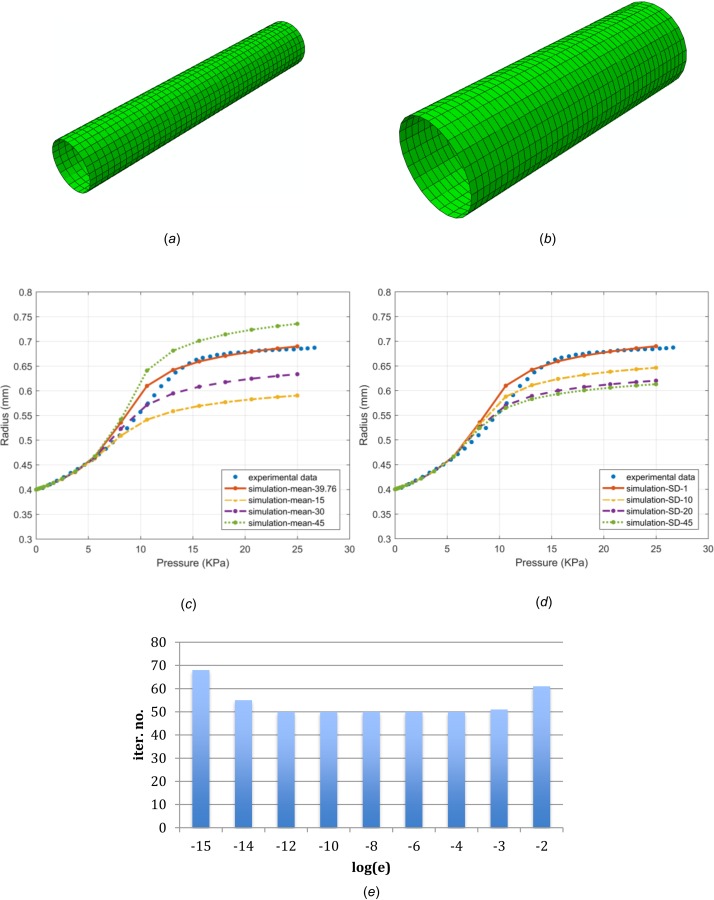
Fig. 3.

FE meshes used in the vessel inflation simulation, before (a) and after (b) deformation; loading pressure versus the outermost radius of the deformed vessel, observed in experiment (dotted line) and numerical simulations. Material models with various mean fiber directions while the other parameters are kept the same as baseline values (c); material models with various standard deviations while the other parameters are kept the same as baseline values (d); and the iteration number at different logarithmic perturbations using the distributed fiber model in the rat carotid artery simulation (e).
