
Figure 4. Treatment of p(I:C)-stimulated macrophages with (PVPON/TA) multilayers dampens expression of the M1 activation marker CD40.
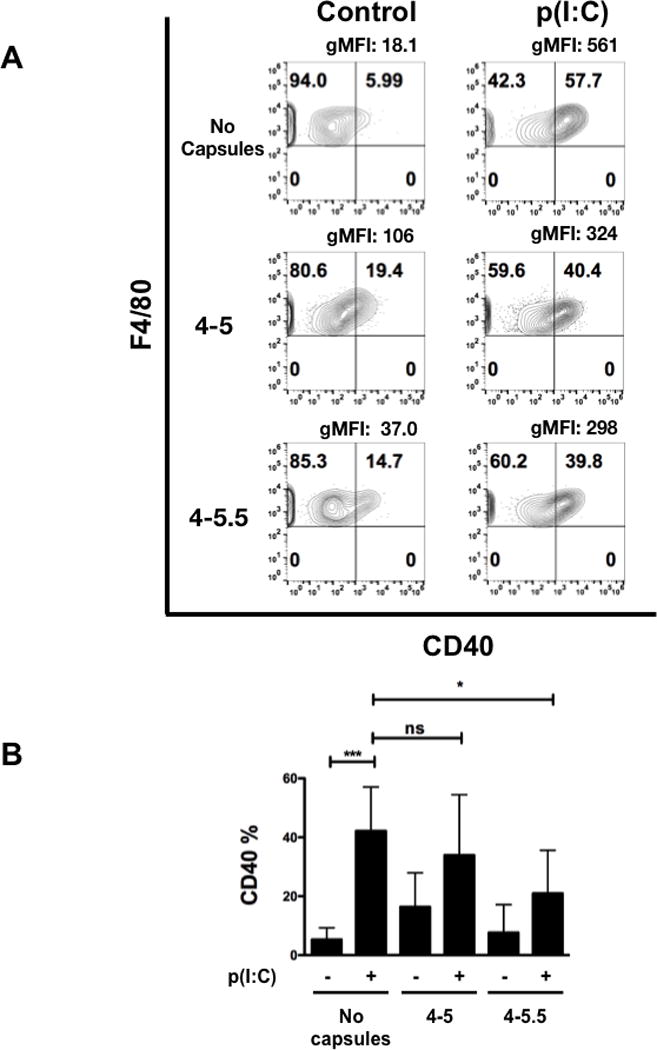
Flow cytometric analysis of CD40 within p(I:C) stimulated BM-Mϕs in the presence or absence of (PVPON/TA) capsules for 24 hours (A). Contour plots represent CD40 by F4/80 of live, F4/80+ macrophages. Geometric mean fluorescence intensity (gMFI) was calculated by gating on F4/80+ cells. Macrophages were gated using forward scatter and side scatter profiles, doublets were excluded, and live cells were gated using side scatter profiles using a fixable live/dead stain, immunophenotyped by F4/80. Pooled CD40 percentages represent 3 independent experiments, depicting the percentage of CD40 expressing cells gated on the live, F4/80+ population (B). ns, not significant; ***p<0.001; *p<0.05.