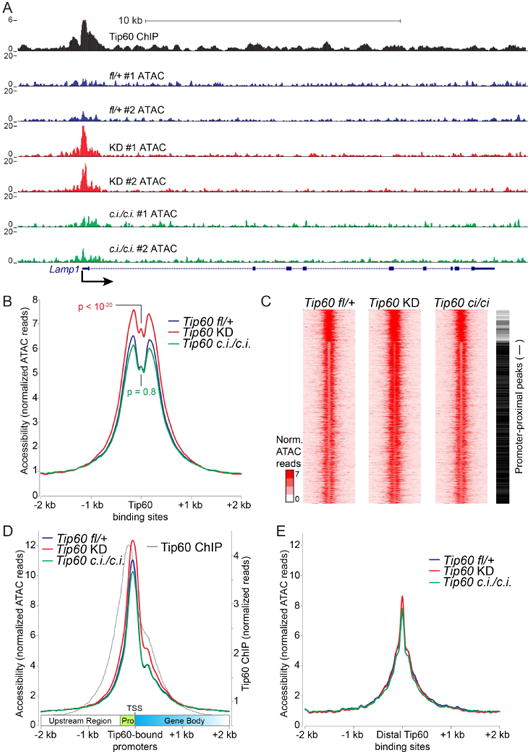
Figure 2. KAT-independent regulation of chromatin accessibility at Tip60 target loci.

(A) Example Tip60 target gene showing increased promoter-proximal chromatin accessibility in Tip60 KD but not Tip60ci/ci relative to Tip60fl/+ control cells. Shown are normalized ATAC-seq reads ≤ 100bp for each biological replicate, and Tip60 ChIP-seq data from (Ravens et al., 2015). (B) Aggregation plot showing average ATAC-seq signal for two biological replicates of each mutant or KD aggregated over high-quality Tip60 binding sites. A Kolmogorov–Smirnov test of differences in ATAC profiles was used to calculate p values. (C) K-means clustering (K=3) for ATAC-seq data over Tip60 binding sites. Promoter-proximal peaks are marked with a black bar to the right, promoter-distal peaks with a white bar. (D) Aggregation plot of ATAC-seq data (as in B) over Tip60–bound promoter regions aligned such that all gene bodies are to the right. Promoter-proximal regions (pro) and transcription start sites (TSS) are indicated. Tip60 ChIP-seq data (Ravens et al., 2015) are shown for reference. (E) Aggregation plot over Tip60–bound gene-distal regions.
