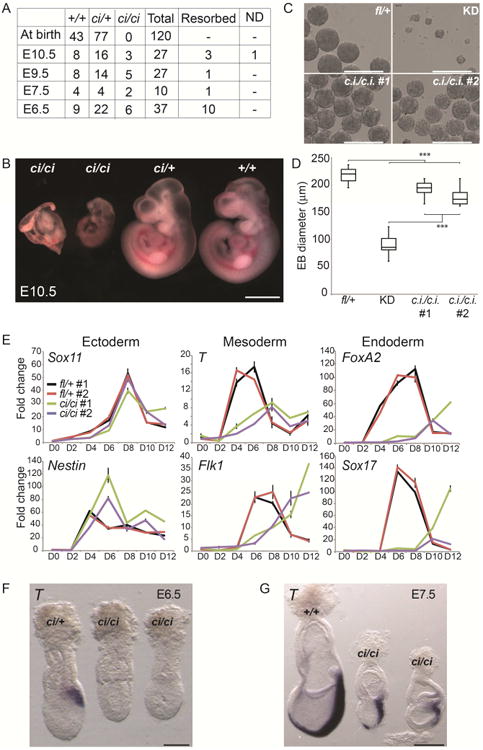
Figure 3. The Tip60 catalytic activity is required for differentiation and post-implantation development.

(A) Genotypes of embryos from Tip60ci/+ intercrosses at different developmental stages. (B) Images of E10.5 embryos of the indicated genotypes. Scale bar equals 1 mm. (C) Embryoid body (EB) formation assay comparing EB morphology in Tip60ci/ci mutant ESCs to Tip60fl/+ and Tip60 KD controls. Scale bars equal 400 μm. (D) Quantification of EB size in indicated mutants and controls (n = 49 per genotype). Boxes range from the 25th to the 75th percentile, the dark lines indicate the median, and the whiskers indicate the lesser of either the extreme (max or min) value or 1.5 times the interquartile range (***p < 0.001, calculated using a two-sided t-test). (E) RT-qPCR analysis of indicated germ layer markers during a time course of EB differentiation. (F, G) Whole mount in situ hybridization in E6.5 and E7.5 mouse embryos staining for T transcript. Scale bars equal 100 μm (F) or 250 μm (G).
