
FIGURE 1.
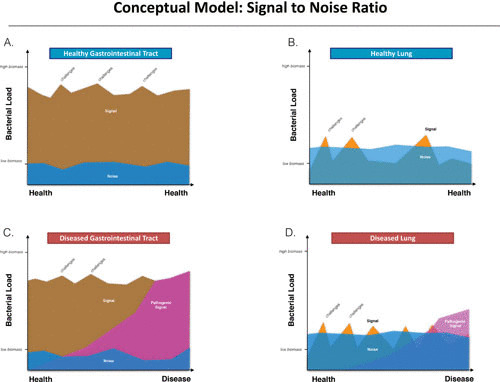
Conceptual model: signal-to-noise ratio. (A) Healthy gastrointestinal microbiome, where there is an organ of healthy biomass and background “noise” or signal amplified by background (e.g., background microbiota present in the colonoscope) that does not represent the gut microbiome. This background microbiome is overwhelmed by the large biomass present the sample. (B) Healthy lung microbiome, where there is relatively low biomass and background signals tend to overwhelm the lung microbiome signal. (C) Diseased gastrointestinal microbiome, where the pathogenic signal (dysbiosis) will eventually overcome the high underlying biomass. The pathogenic signal will overpower the background microbiome and be apparent given the high amount of biomass present in the gut. (D) Diseased lung microbiome. Unlike the diseased gut microbiome, the pathogenic signal may be confounded by the background noise and may not be apparent until sufficient progression of disease supports the altered dysbiosis.