
Figure 6.
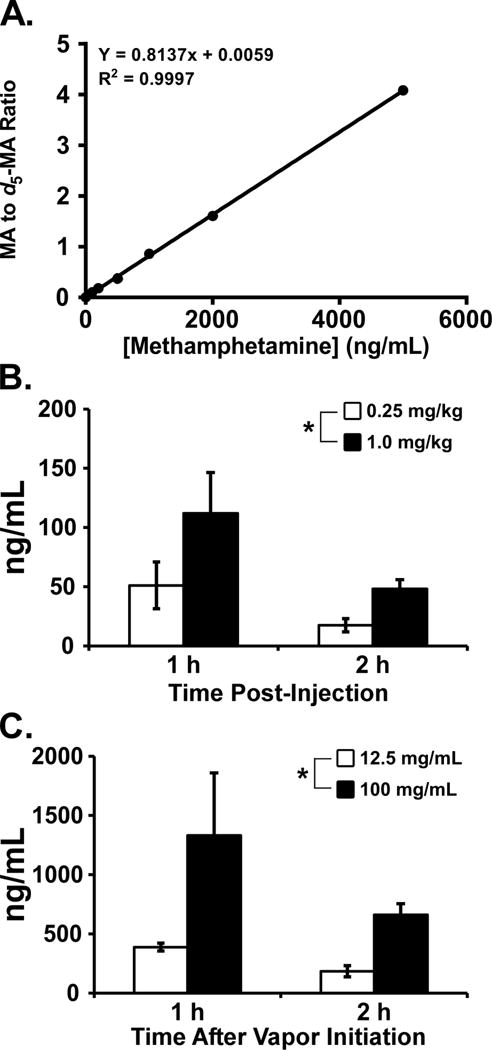
A) Standard curve generated for MA using blank plasma samples and known concentration of drug (0 – 500 ng/mL). Mean (N=4; ±SEM) Concentrations of MA in plasma 1 and 2 hours after B) i.p. injection and C) vapor inhalation. Plasma concentrations were determined by LCMS analysis. A significant effect of dose is indicated by *.