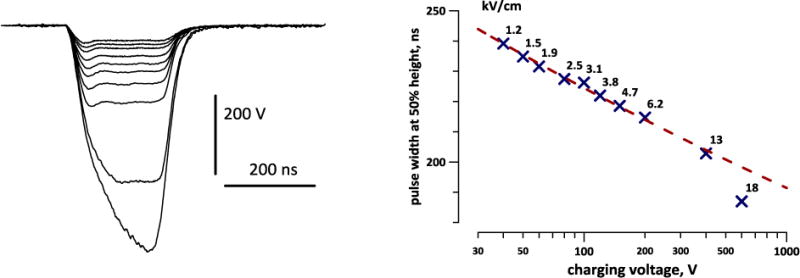
Fig. 1.

Traces of nanosecond pulses at different charging voltages (A) and the respective pulse width and the electric field (kV/cm) at the location of the stimulated neuron (B). The pulses were produced by charging the generator to 40, 50, 60, 80, 100, 120, 150, 200, 400, and 600 V. The amplitude of the pulse at the plateau (40–400V) is approximately the same as the charging voltage. The pulse width was measured at 50% of the plateau or of the peak (600 V). The inset illustrates the position of a stimulated neuron between two electrodes.
