
Fig. 3.
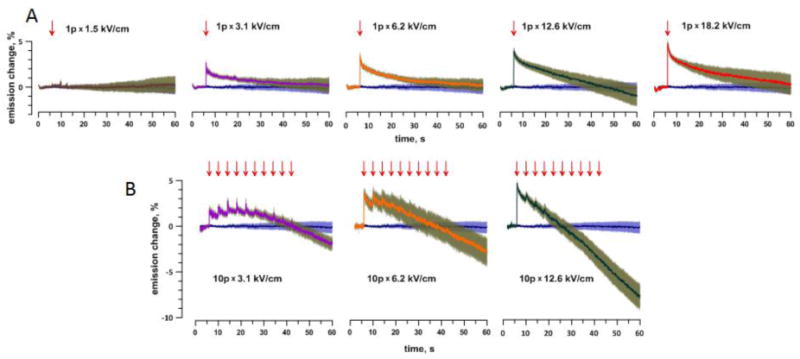
Persistent OMP depolarization in response to a single (A) or multiple (B) nsPEF at different amplitudes. Each panel shows the time course of FluoVolt emission change (%, mean +/− s.e., n=9–32) following the application of a single pulse (“1p”, arrow) or 10 pulses (“10p”) with 4-s intervals. The pulse amplitude (kV/cm) is in the legend. For comparison, each panel also includes the mean+/− s.e. data for a control group (stimulated at 0 kV/cm). All data were corrected for bleaching by subtracting the best fit curve from Fig. 2C. Note that the decrease of emission below the control value (“hyperpolarization”) is an artifact from enhanced dye bleaching in cells severely damaged by nsPEF. See text for more details.