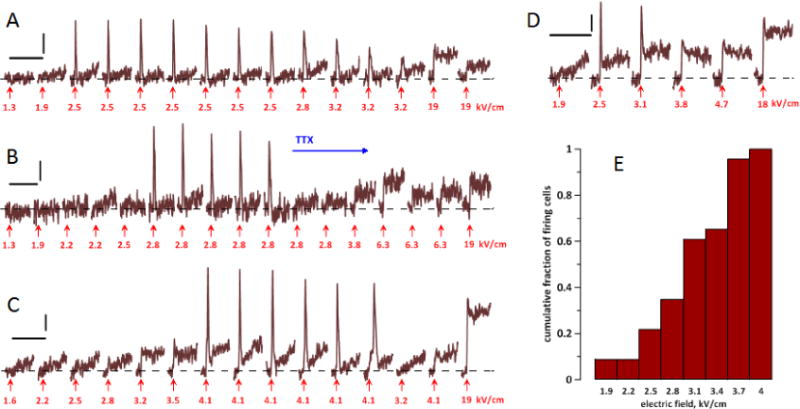
Fig. 5.

The induction of action potentials (APs) by nsPEF in four representative neurons (A–D) and a cumulative histogram of AP thresholds (E). A–D: Each neuron was subjected to multiple OMP recording and stimulation trials. Each trial lasted 193 ms (450 frames), with a single nsPEF applied at 50 ms (arrow); the trials are presented in the sequence they were performed (left to right). The interval between trials was always 1 min. Calibration bars are 200 ms and 1% emission change. The amplitude of each nsPEF is in the legend (kV/cm). APs appear as sharp peaks shortly after nsPEF; electroporation is manifested by the lack of MP return to the base level (dashed line). For noise reduction, all traces were smoothed with a “running average” filter over 9 sequential datapoints. In B, tetrodotoxin (TTX, 2 μM) was added to the bath when indicated. See text for more details. E: The cumulative fraction of cells firing AP at a certain stimulus amplitude (kV/cm), out of all cells which fired AP (n=23). The histogram includes cells both in normal and 0 Ca2+ Tyrode solution.
