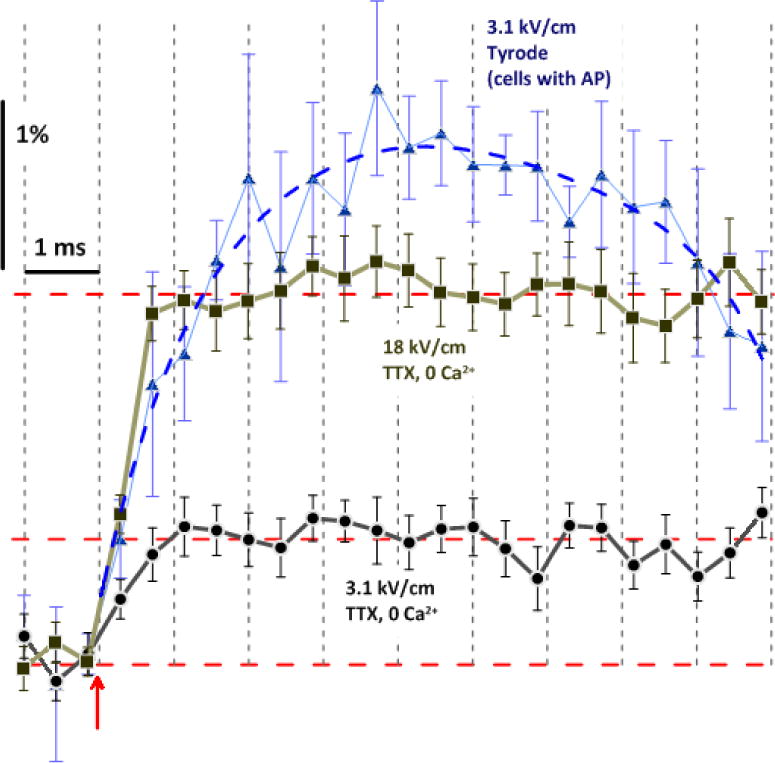
Fig. 7.

High-resolution time dynamics of depolarization and AP generation in response to nsPEF. All data are from respective trials in Fig. 6, plotted on a faster time scale and without “running average” filtering. For 3.1 kV/cm in standard Tyrode, we averaged the data only from those cells which fired AP (mean +/− s.e., n=5). The exposure duration for each frame was 0.43 ms; the datapoint position corresponds to the end of exposure. Note that, without the contribution of VG channels, the plateau level of depolarization (horizontal dashed lines) was reached already during the 2nd frame after nsPEF (arrow), both for 3.1 and 18 kV/cm. For 3.1 kV/cm, the difference between the data for normal Tyrode and TTX, 0 Ca2+ solution is the contribution of VG activation.
