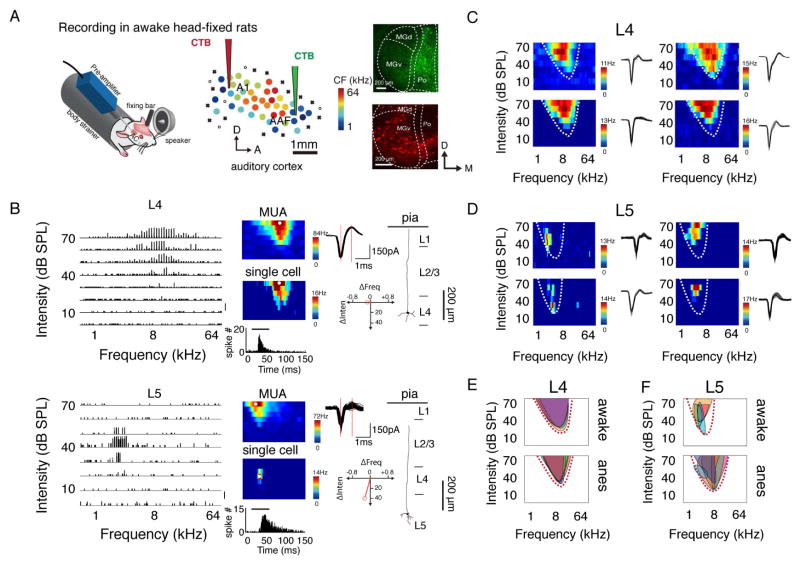
Figure 1. TRFs of single neurons in L5 of AAF differ from those of MUA.
(A) Left, recording setup. Middle, an example mapping of auditory cortex. Color of each dot represents its characteristic frequency (CF). A1, primary auditory cortex; AAF, anterior auditory field; A, anterior; D, dorsal. “x” indicates a site with no detectable multiunit responses to sounds lower than 70 dB SPL. “o” indicates a site that does not show clear frequency tuning but has responses to noise at ≥ 60 dB SPL. Right, retrograde labelling in the thalamus by injecting red and green CTB tracers in the lower frequency regions of A1 and AAF, respectively. (B) Example reconstructed spike TRFs of neurons in L4 and L5 of AAF, which are plotted as an array of PSTHs for the responses to pure tones of different frequency-intensity combinations. Each PSTH trace represents the tone-evoked spike response averaged over 5 repetitions. Bin size, 10 ms. Scale, 0.5 spike count. Middle, color maps represent TRFs of average evoked spiking rate over 3 trials for MUA (upper) and over 5 trials for a single neuron (middle) at the same cortical location. Bottom inset, PSTH generated from the spike responses to all effective tones; the bar represents the duration of tone stimuli. Right, 50 superimposed randomly selected spike waveforms of the neuron with the red vertical lines marking the trough-to-peak interval (upper); red vector depicting the difference in stimulus preference between a single neuron and MUA (lower); reconstructed morphology of the recorded neuron. (C, D) Spike TRFs of four adjacent neurons in L4 (C) and L5 (D). Color map represents averaged spiking rate. Spike waveforms are shown to the right. Dashed curves outline the TRF of MUA at the same location. (E, F) Superimposed spike TRFs of adjacent neurons. Each shaded region represents the TRF of one individual neuron. Top, awake state; bottom, anesthetized state. Dashed curves outline the TRF of MUA at the cortical location.

