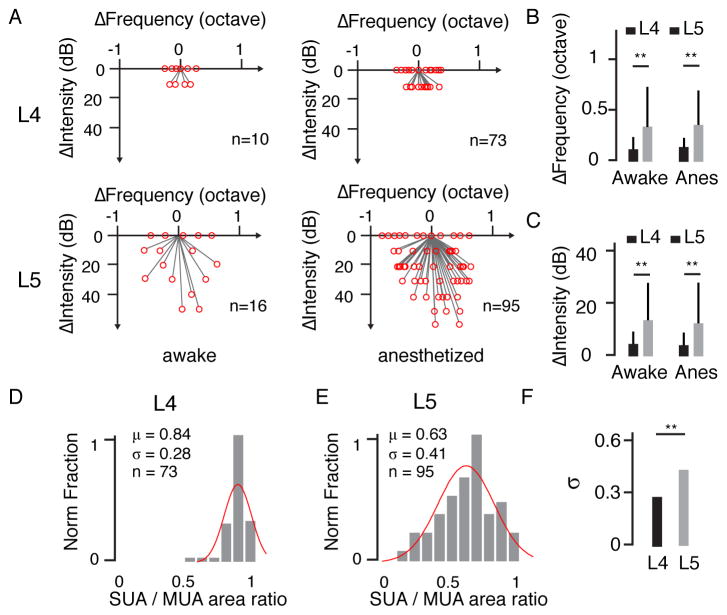
Figure 2. Diverse stimulus preferences of local L5 neurons.
(A) Difference in stimulus preference between a single neuron and the corresponding MUA. Left, awake condition (L4, n = 10; L5, n = 16); right, anesthetized condition (L4, n = 73; L5, n = 95). (B, C) Difference in preferred frequency and preferred intensity between a single neuron (SUA) and its corresponding MUA. **, p < 0.01, Welch t test. (D, E) Normalized distribution of TRF size ratio between SUA and MUA in the anesthetized state. Red curve, fitting with a normal distribution. (F) Comparison of the broadness of the distribution between L4 and L5. **, p < 0.01, F test of equality of variances.

