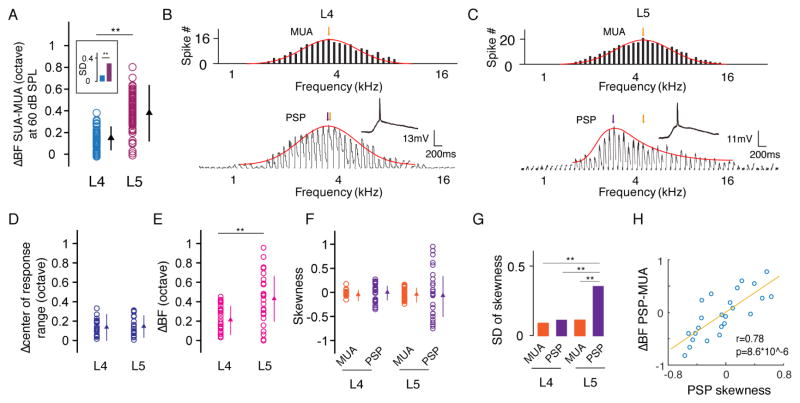
Figure 3. Diversity of membrane potential response tuning.
(A) Difference in BF between SUA and MUA quantified at 60 dB SPL (L4, n = 20; L5, n = 24). **, p < 0.01, Welch t test. The comparison of SD is boxed, **, p < 0.01, F test. (B, C) Comparison of frequency tuning between MUA (upper) and postsynaptic potential (PSP, after filtering out spikes) of a single neuron (lower) at 60 dB SPL. Red curve, fitting with normal or skew normal distribution. The colored arrow points to the BF. (D) Difference in the response range center between MUA and PSP. **, p = 0.51, t test. Bar = SD. (E) Difference in BF between MUA and PSP. **, p < 0.01, t test. Bar = SD. (F) Skewness of MUA and PSP tuning. Bar = SD. (G) SD of the skewness values of MUA and PSP tuning. **, p < 0.01, F test. (H) Difference in BF between PSP and MUA plotted against the skewness of PSP tuning.

