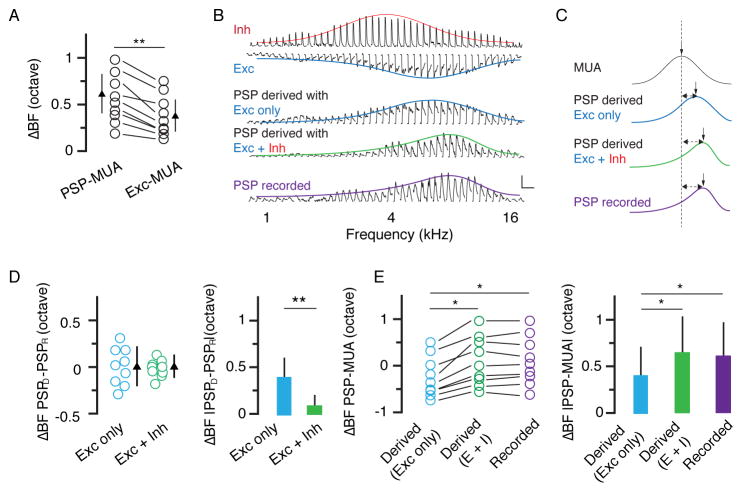
Figure 5. Inhibition expands tuning diversity in L5.
(A) Difference in BF between PSP and MUA and that between excitation and MUA. **, p < 0.01, paired t test. (B) Tuning curves of inhibition, excitation, PSP derived from excitation only, PSP derived from the integration of excitation and inhibition, and recorded PSP for an example L5 neuron. Scale: 10 mV and 200 ms. (C) Comparison of fitted normal or skew normal distribution curves of the same cell in (B). The vertical arrow points to the BF. The dashed line marks the BF of MUA. (D) Difference in BF between derived PSP and recorded PSP. Bar = SD. Right, same data but in absolute value. **, p < 0.01, paired t test. (E) Difference in BF between PSP (derived or recorded) and MUA. Data points obtained from the same neuron are connected with lines. *, p < 0.05, one-way ANOVA, post hoc test. Right, same data but in absolute value. *, p < 0.05, one-way ANOVA, post hoc test.

