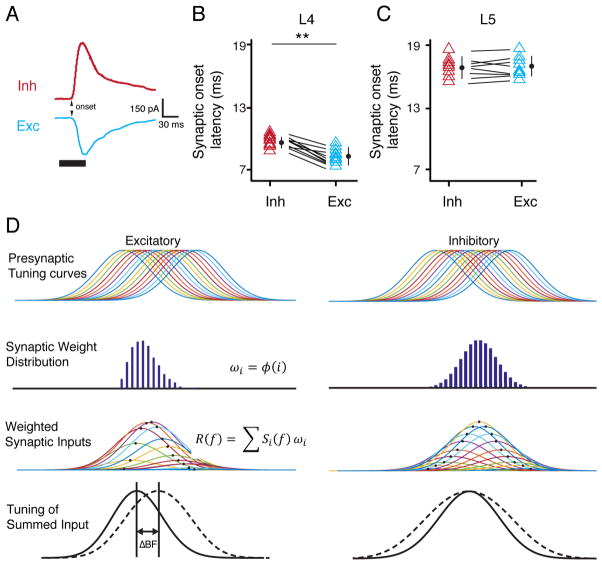
Figure 6. Onset latencies of synaptic inputs to L5 neurons and a proposed model.
(A) Average recorded synaptic responses to BF tone in an example L5 neuron. Inh, inhibition; Exc, excitation. Arrow points to the synaptic onset. (B, C) Synaptic onset latencies of excitation and inhibition in L4 and L5 neurons. **, p < 0.01, paired t test. Bar = SD. (D) First row, symmetric tuning curves of output responses of a series of presynaptic (excitatory and inhibitory) neurons for an L5 cell. Second row, distribution of synaptic weights of the inputs, which is asymmetric for excitatory inputs but symmetric for inhibitory inputs. Third row, tuning curves of weighted synaptic inputs (output times synaptic weight). Fourth row, summing up the individual curves of weighted synaptic input (solid curve) produces asymmetric excitatory tuning and symmetric inhibitory tuning. The dashed curve represents the sum of synaptic inputs of equal strengths.

