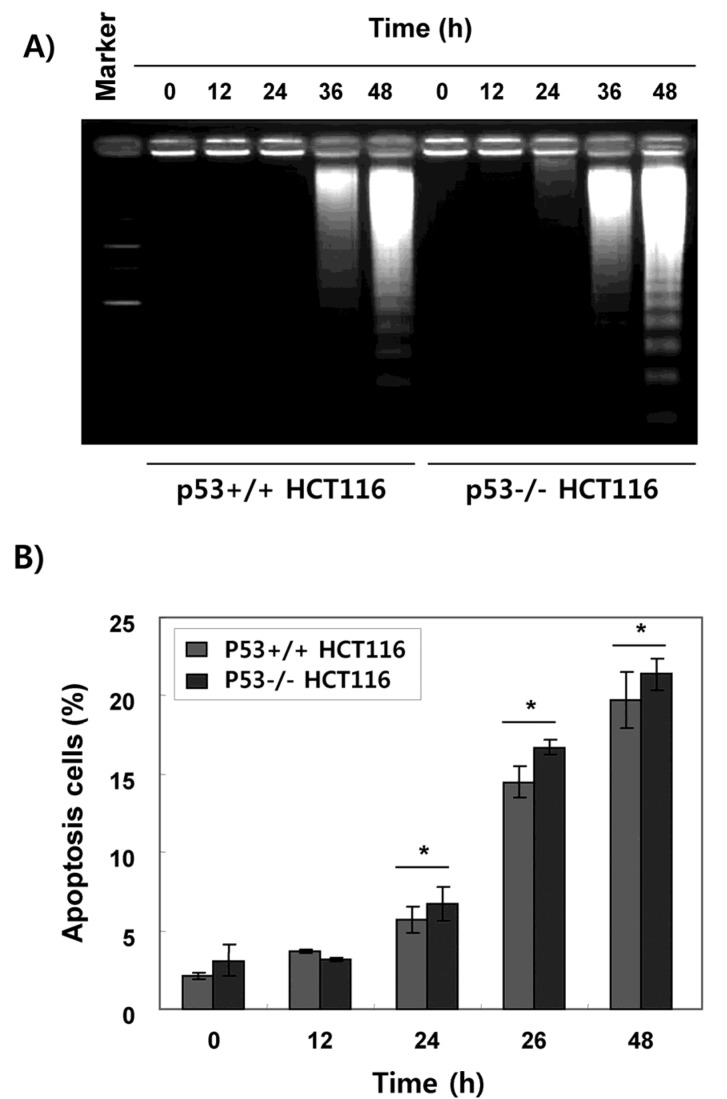
Figure 3.
Induction of apoptosis by fucoidan in HCT116 cells. p53+/+ and p53−/− HCT116 cells were treated with 150 μg/mL fucoidan for various times. (A) The cells were collected, and the extracted fragmented DNA was separated on 1.5% agarose gel and visualized under ultraviolet (UV) light by ethidium bromide (EtBr) staining. (B) The cells were stained with propidium iodide (PI) for DNA flow cytometry analysis. Percentages of apoptotic cells were determined by counting the sub-G1 phase cell population. Data are expressed as the mean ± SD of three independent experiments. Significance was determined by the Student t-test 0.0 (* p < 5 vs. untreated control).

