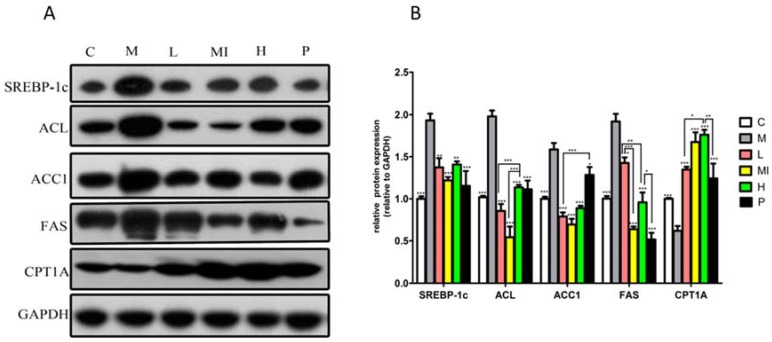
Figure 3.
Western blot analysis of SREBP1-C, ACC1, FAS, ACL, and CPT1-A protein levels in mice liver treated with xyloketal B for 40 days. Representative immunoblots (A) and quantification (B) of the expression of proteins related to lipid metabolism in mice liver. C: control group; M: HFD+HFL group; L: 5 mg/kg/d xyloketal B group; Mi: 10 mg/kg/d xyloketal B group; H: 20 mg/kg/d xyloketal B group; P: 15 mg/kg/d atorvastatin group. Data are expressed as the means ± SEM (n = 8). * p < 0.05, ** p < 0.01, and *** p < 0.001 versus the M group.

