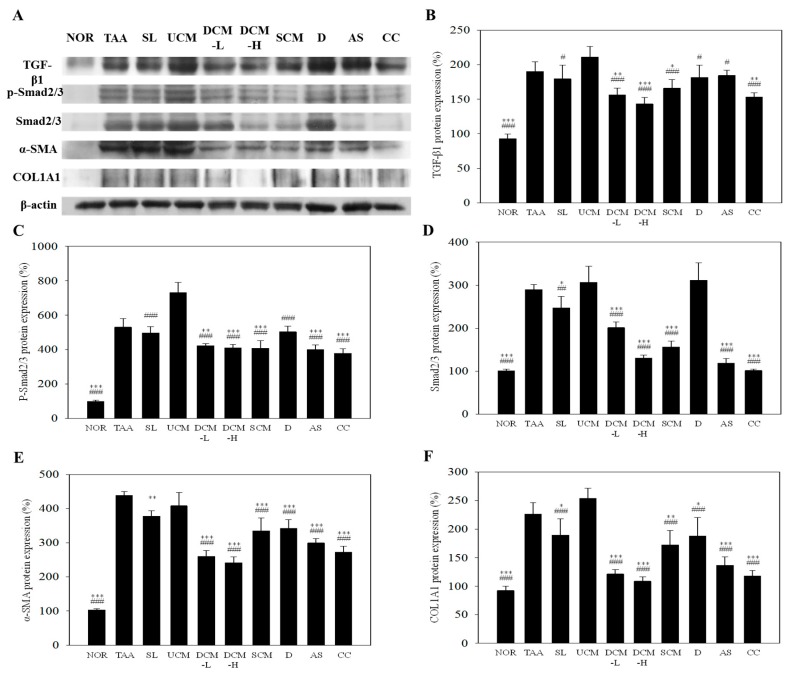
Figure 4.
The effect of C. militaris-fermented product cultured with various waters on haptatic TGF-β1, p-Smad2/3, Smad2/3, α-SMA, and COL1A1 protein expression in the TAA-induced liver fibrosis mice. Target protein expressions were visualized using immunoblotting (A) and quantified using gel analysis software (B–E). NOR: normal group, TAA: TAA-induced mice (TAA 100 mg/kg/i.p., three times per week), SL: TAA-induced mice fed silymarin (75 mg/kg/day), UCM: TAA-induced mice fed a one-fold dose of UCM (0.603 g/kg/day), DCM-L: TAA-induced mice fed a one-fold dose of DCM (0.603 g/kg/day), DCM-H: TAA-induced mice fed a three-fold dose of DCM (1.809 g/kg/day), SCM: TAA-induced mice fed 1-fold dose of SCM (0.603 g/kg/day), DOW: TAA-induced mice fed with DOW (0.603 mL/kg/day), AS: TAA-induced mice fed with adenosine (0.329 mg/kg/day), CC: TAA-induced mice fed with cordycepin (0.615 mg/kg/day). * p < 0.05, ** p < 0.01, *** p < 0.001 vs. TAA group. # p < 0.05, ## p < 0.01, ### p < 0.001 vs. UCM group.

