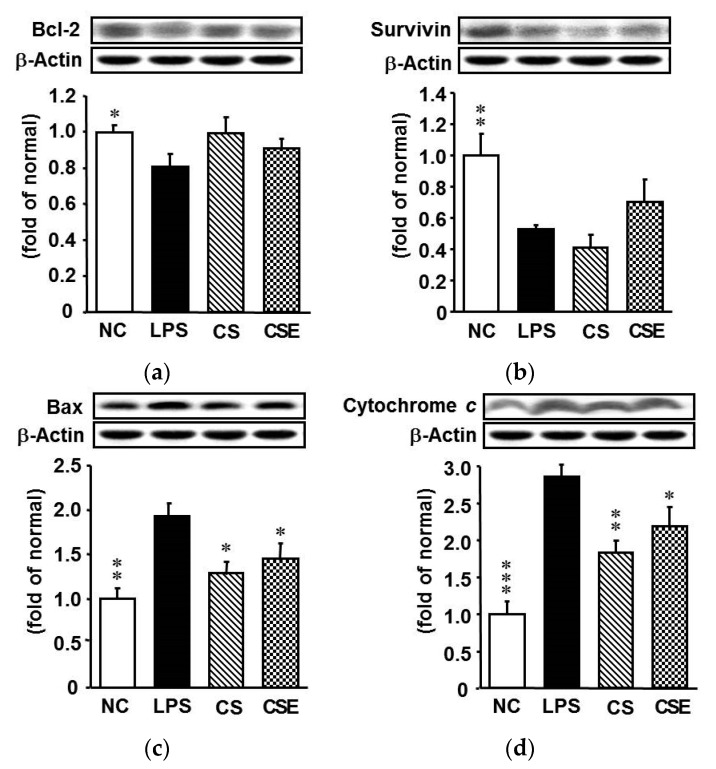
Figure 5.
Protein expression of apoptosis-related factors in the hepatic tissue of lipopolysaccharide-induced ICR mice. (a) Bcl-2; (b) Survivin; (c) Bax; (d) Cytochrome c. NC, normal control mice; LPS, vehicle-treated LPS mice; CS, 200 mg/kg body weight chondroitin sulfate in LPS mice; CSE, 400 mg/kg body weight chondroitin sulfate preparation from skate cartilage in LPS mice. Data are the means ± S.E.M. (n = 8 mice per group). Significance: * p < 0.05, ** p < 0.01, *** p < 0.001 vs. vehicle-treated LPS mice.

