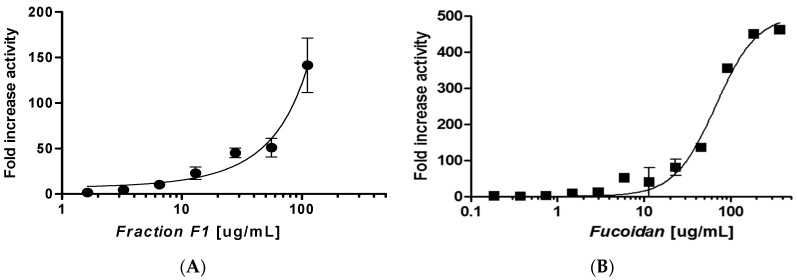
Figure 6.
(A) Dose-response curve of the extract sub-fraction of F1 (●) in the presence of 500 µM NAD+ and 40 µM H3K9Ac with 30 min of incubation time. The data are presented as means ± SD, n = 3; (B) Dose-response curve of fucoidan (■) on SIRT6 deacetylation activity in the presence of 500 µM NAD+ and 40 µM H3K9Ac with 30 min of incubation time. The data are presented as means ± SD, n = 3.

