
Fig. 1. DNA juxtaposition propagates from condensin's loading site.
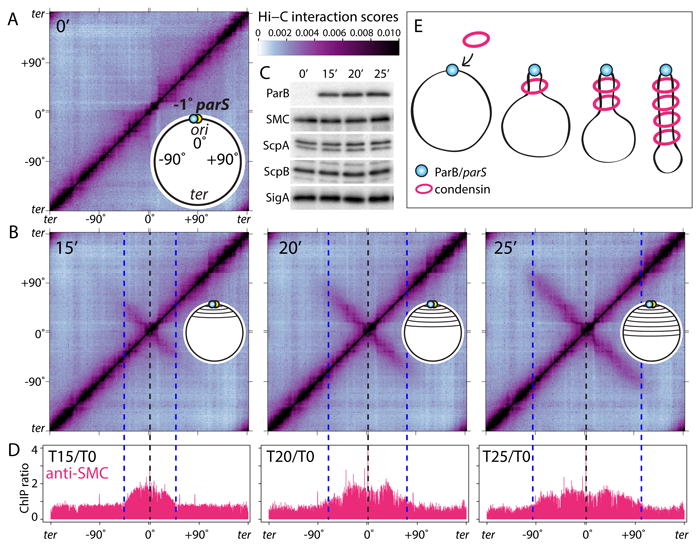
(A-B) Normalized Hi-C interaction maps displaying contact frequencies for pairs of 10 kb bins. The strain (BWX3352) contains a single parS site at -1° and an IPTG-inducible gfp-parB fusion. Maps show interaction frequencies before (A) and after induction (B) with IPTG. Axes present genome positions in degrees and are oriented with the replication origin at the center. Schematics of the juxtaposed regions are shown. The scale bar depicts Hi-C interaction scores for all contact maps presented in this study. The dotted lines indicate the -1° parS site (black) and the leading edge of the juxtaposed DNA (blue). (C) Immunoblot analysis of the same samples from (A) showing GFP-ParB accumulation, the levels of the condensin complex (SMC, ScpA, ScpB) and SigA to control for loading. (D) Anti-SMC ChIP-seq performed under the same condition as in (A-B). Sequencing reads from ChIP and input samples were normalized to the total number of reads. The ratio of ChIP enrichment (ChIP/Input) at each time point relative to time 0 is shown in 1 kb bins. (E) Schematic interpretation of the Hi-C and ChIP-seq data. Progressive juxtaposition enlarges a DNA loop centered on parS.