
Figure 3. Condensin complexes loaded at parS travel down the flanking DNA.
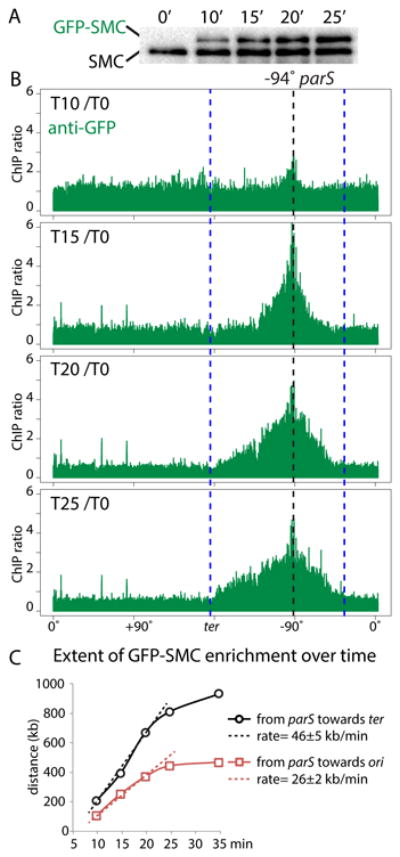
Cells (BWX3690) harboring a single parS site at -94° with wild-type SMC and an IPTG-inducible gfp-smc fusion we analyzed before an after induction. (A) Immunoblot analysis of GFP-SMC levels (using anti-SMC antibodies) during the induction time course. (B) ChIP-seq enrichment using anti-GFP antibodies. The ratio of ChIP enrichment at the indicated time point relative to time 0 (before induction) is plotted in 1 kb bins. Dotted lines indicate the position of the parS site (black) and the extent of ChIP enrichment of untagged SMC at time 0 (blue). (C) The accumulation of GFP-SMC from the parS towards the origin (red squares) and terminus (black circles) are plotted. The rates of GFP-SMC accumulation were calculated using the first three time points. See Figure S8 for unprocessed data and additional analysis.