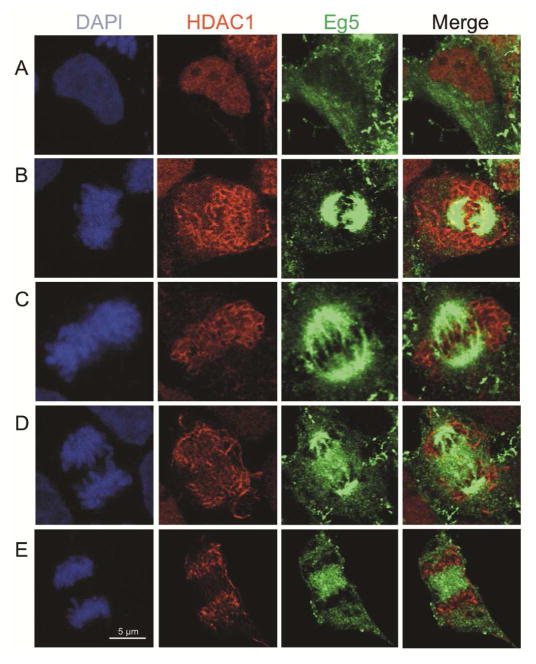
Figure 6.
Eg5 colocalized with HDAC1 during prophase. HEK293 cells were fixed and stained with HDAC1 (red) and Eg5 (green) antibodies. Cells were counterstained with DAPI (blue). Confocal microscopy was used to visualize HDAC1 and Eg5 in each cell. Cells in interphase (A), prophase (B), metaphase (C), anaphase (D), and telophase (E) are shown. HDAC1 (red) and Eg5 (green) images were used to generate merged images (yellow).

