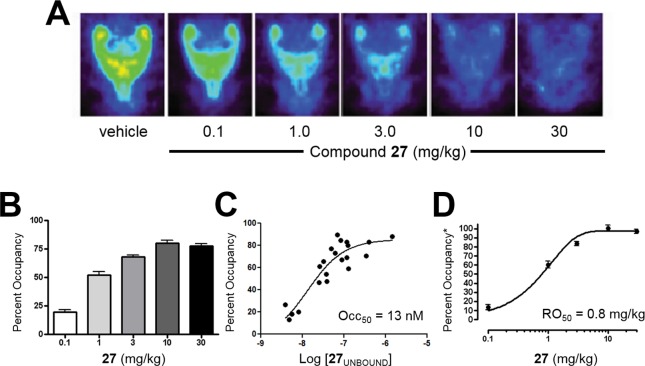
Figure 5.
Imaging studies in rodents; n = 4–8 Sprague–Dawley rats; 27 vehicle = 10% polysorbate 80 in 0.5% methyl cellulose; 27 dosed 30 min prior to [18F]-41 (IV). (A) Representative images of [18F]-41 by increasing oral doses of 27. (B) mGlu5 RO obtained with [18F]-41 and increasing oral doses of 27. (C) Unbound maximum plasma concentration of 27 versus mGlu5 RO. (D) Dose of 27 versus mGlu5 RO; *normalized to the maximum displacement of [18F]-41.

