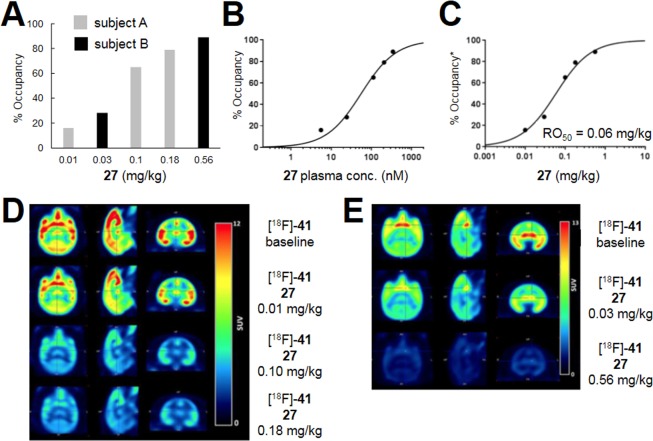
Figure 6.
Imaging studies in female baboons: subject A received three doses (0.01, 0.1, and 0.18 mg/kg); subject B received two doses (0.03 and 0.56 mg/kg); 27 vehicle = 10% ethanol, 30% PEG 400, 20% hydroxypropyl-β-cyclodextrin in water; 27 dosed over 20 min, 30 min prior to [18F]-41 (IV, 3 min bolus) for all doses except the 0.18 mg/kg dose, which was dosed over 2 min, 50 min prior to [18F]-41. (A) mGlu5 RO obtained in two female baboons with [18F]-41 and increasing IV doses of 27. (B) Total maximum plasma concentration of 27 versus mGlu5 RO. (C) Dose of 27 versus mGlu5 RO. (D) Images for subject A averaged from 0 to 150 min. (E) Images for subject B averaged from 0 to 180 min.

