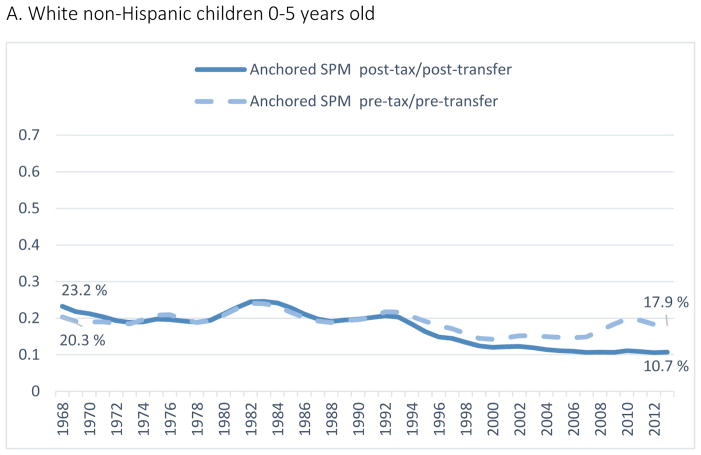
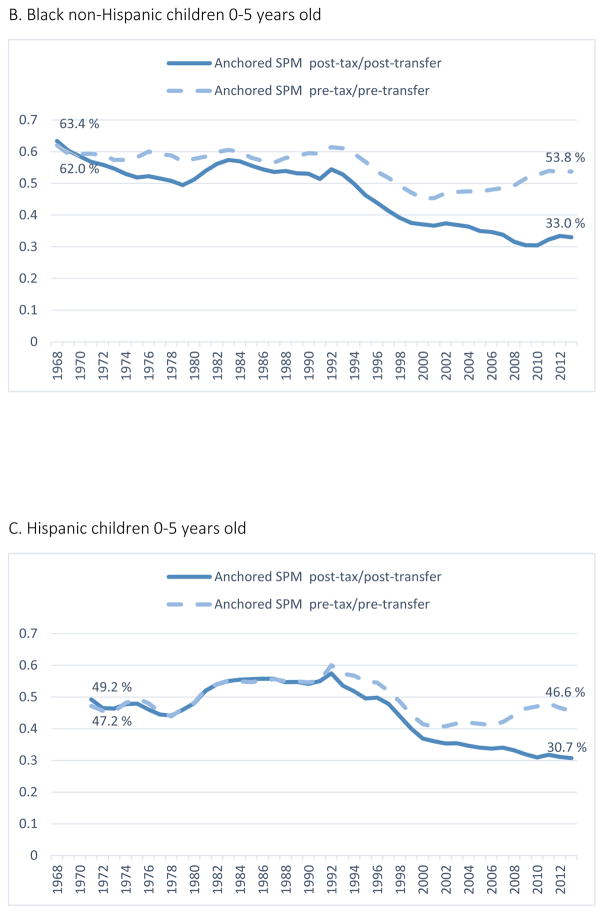
Figure 3.
Trends in young child poverty, by race/ethnicity
Note: 3-year moving averages of Anchored SPM Poverty with geographically-adjusted thresholds
Note: 3-year moving averages of Anchored SPM Poverty with geographically-adjusted thresholds
Note: 3-year moving averages of Anchored SPM Poverty with geographically-adjusted thresholds. This graph begins at 1971 because Hispanic children are only identifiable in the CPS ASEC from 1970 onward.


